-
Video: Occupy Sacramento Folks are Working on Why They Are Protesting
Watch it all and just wonder in amazement….
-
American Unemployment Rate Steady at 9.1% Beating Tepid Expectations
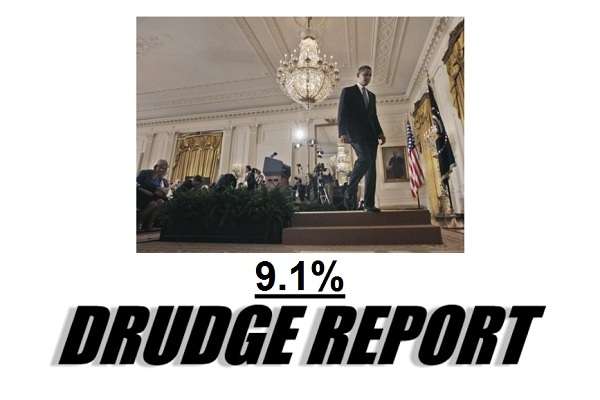
Not the greatest, but 103,000 new jobs were added, albeit almost half were added because Verizon employees came off a strike.
The U.S. jobs picture beat tepid expectations, with the economy creating a significantly better than expected 103,000 new jobs in September that nonetheless was not enough to cut the unemployment rate from 9.1 percent.Economists had been looking for 60,000 total new nonfarm jobs, a month after the shock that the U.S. had created a net of zero new jobs.
That August number, though, was revised upward in the latest report, to show the economy creating 57,000 jobs for the month.
“Today’s data show the persistence of merely moderate employment gains,” Citigroup economist Steven Wieting said in a note. “Employment can be a poor guide to more than the immediate future, but the data confirm our view that early August economic reports exaggerated U.S. weakness.
Getting the jobs market rolling again is seen as one of the two central spokes — the other being housing — in preventing the US economy from entering another recession.
Friday’s numbers offered mild consolation to those hoping that the US can at least plod along if not move into expansion mode.
Striking Verizon workers back on the job fed much of the gains as 45,000 of the telecom giant’s employees came off the picket lines and the unemployment rolls.
Average hourly earnings in September rose slightly to $23.12.
“In the big picture, today’s reading soothes recessionary fears,” said Andrew Wilkinson, chief economic strategist at Miller Tabak in New York.
The enthusiasm, albeit muted, was not universally shared.
“The September performance is more of a dead cat bounce than real progress,” Peter Morici, economist at the University of Maryland, said in a snap analysis. “Jobs creation will remain inadequate to keep unemployment from falling in the months ahead, especially considering the mass layoffs recently announced in banking and pharmaceuticals that will be effected in the months ahead.”
Long-term unemployment remains a problem, as the average duration of joblessness ticked up to a new record of 40.5 weeks. The number of those out of work for more than 20 weeks rose 208,000 to 6.24 million.
The manufacturing sector shed 13,000 jobs, posting a drop for the second month in a row. But the household survey, which is a more methodical count that doesn’t utilize estimations in the way the larger survey does, showed a net job creation of 137,000.
The level of unemployed people remained unchanged, though, at 14 million.
The jobs market is stagnant as is the rest of the economy. There will probably not be any movement until the direction of federal government initiatives are made clear and the Presidential campaign season offers some clarity.
-
President 2012 Poll Watch: Obama Approval Rating Remains at All Term Low of 41%
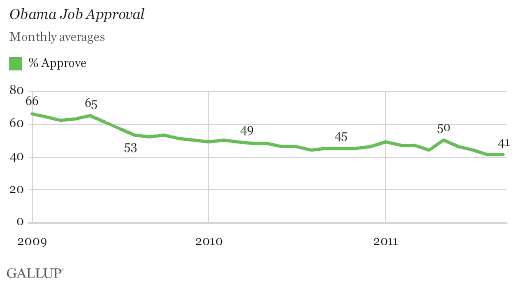 According to the latest Gallup Poll.
President Barack Obama’s job approval rating averaged 41% in September, tied with August for the lowest monthly approval average of his administration.
Obama began his term with average approval ratings of 66% in January 2009 and 64% in February 2009. His ratings gradually drifted downward from that point, with a slight uptick in January of this year and again in May, after the killing of Osama bin Laden.
But, is it too early to predict the November 12 Obama re-election?
Perhaps.
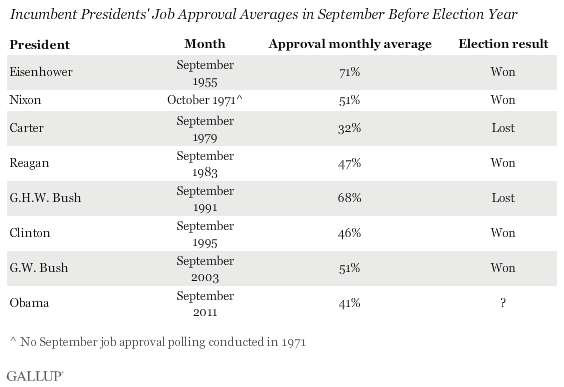
Thirteen months from now, Americans will vote on whether to give Obama a second term in office. While Obama’s September job approval average may not appear to bode well for him, history shows that approval ratings at this juncture are not strongly predictive of an incumbent president’s re-election chances. Jimmy Carter in 1979 had lower monthly average approval ratings in September of the year before his election than Obama has now. Carter went on to lose his re-election bid. George H.W. Bush’s approval rating in September of 1991 was 68%, second only to Dwight Eisenhower’s 71% in September 1955. Bush went on to lose the 1992 election to Bill Clinton.
The chart:
The Demographic chart of Obama approval tells a story.
Obama’s approval ratings vary widely across demographic groups, reflecting the general structure of partisanship in the U.S. population today. Blacks, nonwhites, those with postgraduate educations, Hispanics, young and unmarried Americans, and those living in the East were among the most approving of Obama in September.
Obama’s approval ratings are below average among whites, married Americans, those aged 65 and older, and Southerners.
The chart:
So, what does this all mean?
President Obama is in deep trouble and is looking like a one term President ala Jimmy Carter.
President Obama’s monthly job approval rating remains at 41% in September, tied for the lowest monthly average of his administration. His job rating will become an increasingly important predictor of his re-election chances as each month goes by, although history shows that candidates’ ratings in September of the year before an election can still change significantly in the 13 months leading up to that election. At this point Obama’s ratings are well below the 48% to 50% approval threshold that a president generally needs to be re-elected.
Americans’ views of Obama have become somewhat more polarized over the course of his administration to date. Democrats’ ratings are now higher relative to other groups than they were in 2009, while Republicans’ ratings are lower compared with other groups. Obama’s support among blacks and those with postgraduate education remains high compared with the national average, while his support among high-income Americans and Hispanics has weakened.
-
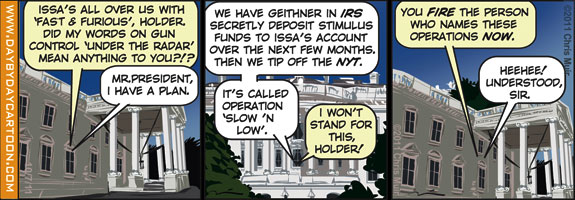
Day By Day October 7, 2011 – Words
-
@Flap Twitter Updates for 2011-10-07
- At the WaterWise reception (@ South Point Hotel & Casino w/ 2 others) http://t.co/lNfECLNx #
- Only more than 1,500 lawsuits to go….: http://t.co/bZBXSTQd #
- Merck Wins Another Fosamax Lawsuit http://t.co/N2HLrtH0 #
- California Governor Jerry Brown Signs Prison Cell Phone Bill » Flap's California Blog http://t.co/ijKeqh8z #
- President 2012: After Christie Opts Out Romney Picks Up Donors http://t.co/tSnsTukU #tcot #catcot #
- Methamphetamine Making Chemicals Seized at Los Angeles International Airport | Flap's Blog – FullosseousFlap's D… http://t.co/heS3FAhe #
- Steve Jobs and Why Pancreatic Cancer is SO Deadly | Smiles For A Lifetime – Temporary (Locum Tenens) Dentistry http://t.co/JRAuqKYJ #
- Flap's Dentistry Blog: Heartland Dental Care Acquires Neibauer Dental Corporation With 26 Offices http://t.co/zMy6zx6n #
- California Governor Jerry Brown Signs Prison Cell Phone Bill http://t.co/ijKeqh8z #
- Cell phones are becoming an increasing problem in California State prisons….
: http://t.co/B0tAERdm # - Flap's Dentistry Blog: Tanning Beds May Be More Likely to Cause Skin Cancer Than Previously Believed http://t.co/Wq4zjOOg #
- Methamphetamine Making Chemicals Seized at Los Angeles International Airport http://t.co/NPqzXrCm #tcot #catcot #
- Steve Jobs and Why Pancreatic Cancer is SO Deadly http://t.co/JRAuqKYJ #
- Heartland Dental Care acquires 26 dental offices in Mid-Atlantic states: http://t.co/u5Tlt2jY #
- Heartland Dental Care Acquires Neibauer Dental Corporation With 26 Offices http://t.co/fHolUCCQ #
- Pancreatic cancer is a rare, silent but very deadly disease…..: http://t.co/gMsbteGQ #
- A Record-Setting Decade of Immigration: 2000-2010 http://t.co/kQEldGrh #
- Day By Day October 6, 2011 – Lights Out | Flap's Blog – FullosseousFlap's Dental Blog http://t.co/rf4DDT1r #
- @Flap Twitter Updates for 2011-10-06 | Flap's Blog – FullosseousFlap's Dental Blog http://t.co/yevBD4Ch #
- Just say NO to indoor tanning beds – like smoking for your skin….: http://t.co/zcDPQi7z #
- Tanning Beds May Be More Likely to Cause Skin Cancer Than Previously Believed http://t.co/TatXN49E #
- Gallup Poll measured U.S. unemployment rate improves slightly with a big but…….: http://t.co/oFrHvqI1 #
- Poll Watch: U.S. Unemployment Rate Falls to 8.7% and Underemployment Rate Down Slightly – But….. http://t.co/LWQgLDrB #tcot #catcot #
- California Proposition 8 Will NOT Have Repeal Election in 2012 http://t.co/NUUs0adX #
- Dilbert October 6, 2011 – 99% http://t.co/xjBkbSAu #
- California Proposition 8 will NOT be on ballot in 2012…..
: http://t.co/zlDhp9ZA # - Scott Adams and Dilbert go on to explain the 99% rule…..
: http://t.co/lex41S8m # - Chris Muir and Day By Day depict the Obama Green Jobs Crony Capitalism = Chicagoland Way Cash Out: http://t.co/gC9InFAF #
- Day By Day October 6, 2011 – Lights Out http://t.co/PLiHR4gj #tcot #catcot #
- And, so it begins: the wedding weekend of Ashley Cole and Jesse Munoz in Las Vegas #
- @Flap Twitter Updates for 2011-10-06 http://t.co/3hJTdM4l #tcot #catcot #
Powered by Twitter Tools