-
Fiscal Cliff Poll: Obama Seen as Victor But What About the Legislation?
Maybe President Obama looks better than GOP Speaker John Boehner and the feckless Republicans/Democrats in Congress. But, what about the law itself?
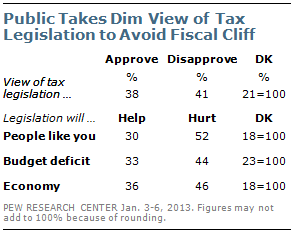
Barack Obama is viewed as the clear political winner in the fiscal cliff negotiations, but the legislation itself gets only a lukewarm reception from the public: As many disapprove as approve of the new tax legislation, and more say it will have a negative than positive impact on the federal budget deficit, the national economy and people like themselves.
The latest national survey by the Pew Research Center for the People & the Press, conducted Jan. 3-6 among 1,003 adults, finds that 57% say that Obama got more of what he wanted from the tax legislation while just 20% say Republican leaders got more of what they wanted. And while 48% approve of the way Obama handled the fiscal cliff negotiations only 19% approve of the way GOP leaders handled the negotiations.
Republicans take a particularly sour view of the outcome: just 16% approve of the final legislation, and by a 74% to 11% margin they think Obama got more of what he wanted. Only 40% of Republicans approve of how their party’s leaders handled the negotiations; by comparison, fully 81% of Democrats approve of how Obama handled the negotiations.
Relatively few Americans expect that the tax legislation that resulted from those talks will help people like themselves, the budget deficit, or the national economy. Just three-in-ten Americans say the tax measure will mostly help people like them; 52% say it will mostly hurt. And even when it comes to the budget deficit, 44% say the deal will mostly hurt, while 33% say it will mostly help.
President Obama does not have to run for President again and the repercussions of the Fiscal Cliff legislation as of yet realized will have no effect on him. But, should the economy fail to rally his Democratic Party will pay the price at the 2014 elections.
Stay tuned as the details of fiscal cliff, sequestration and the debt limit play through the American economy. My bet is that Obama will NOT be viewed as a political winner, when all is said and done.
-
Gallup Poll: American Majority Against Government Healthcare Guarantee

Not a good sign with ObamaCare implementation due by 2014.
For the first time in Gallup trends since 2000, a majority of Americans say it is not the federal government’s responsibility to make sure all Americans have healthcare coverage. Prior to 2009, a majority always felt the government should ensure healthcare coverage for all, though Americans’ views have become more divided in recent years.
The shift away from the view that the government should ensure healthcare coverage for all began shortly after President Barack Obama’s election and has continued the past several years during the discussions and ultimate passage of the Affordable Care Act in March 2010. Americans are divided on that legislation today — 48% approve and 45% disapprove — as they have been over the last several years.
Republicans, including Republican-leaning independents, are mostly responsible for the drop since 2007 in Americans’ support for government ensuring universal health coverage. In 2007, 38% of Republicans thought the government should do so; now, 12% do. Among Democrats and Democratic leaners there has been a much smaller drop, from 81% saying the government should make sure all Americans are covered in 2007 to 71% now.
One thing that has not changed is that Americans still widely prefer a system based on private insurance to one run by the government. Currently, 57% prefer a private system and 36% a government-run system, essentially the same as in 2010 and 2011. Prior to the passage of the Affordable Care Act in 2010, the percentage of Americans in favor of a government-run system ranged from 32% to 41%.
I think folks see that the costs will be tremendous and the government healthcare system bureaucratic and intrusive.
America continues as a right-center country where self-reliance is more innate than not.
Redistribution is not the American way and that is reflected in this poll.
Over the next few years, the U.S. healthcare system will undergo significant changes as more parts of the Affordable Care Act go into effect. To date, the passage of the law has not led to a major transformation in U.S. healthcare attitudes, apart from the shift away from the view that the government should ensure all Americans have healthcare.
However, this year’s Health and Healthcare poll could signal the beginning of somewhat less negative views of the U.S. healthcare system. Americans have always been positive about the quality of healthcare they receive. Though they remain more negative than positive about healthcare coverage, Americans’ opinions are trending toward a more positive view of health coverage. Americans remain broadly dissatisfied with U.S. healthcare costs, and it is unclear at this point whether the healthcare reforms will significantly reduce U.S. healthcare costs once the law is fully implemented.
-
Gallup: U.S. Unemployment Rate Increases to 7.4 Per Cent in Mid-November
 According to the latest Gallup Poll.
U.S. unemployment, as measured by Gallup without seasonal adjustment, is 7.4% in mid-November, up from 7.0% in October but below the 7.9% of September. Seasonally adjusted unemployment is 7.9%, up from 7.4% in October but slightly lower than September’s 8.1%.
The American economy continues in the doldrums.
Let’s hope a good Christmas retail season bolsters employment some.
But, the elephant in the closet is the impending implementation of ObamaCare and business being leery of increasing their number of employees at the same time.
Gallup’s unemployment results for the 30 days ending on Nov. 15 suggest that the improvement in the U.S. unemployment situation found in October was short-lived. Still, on an unadjusted basis, Gallup’s unemployment and underemployment measures over the past two months show what might be expected holiday seasonal improvement. U.S. companies increase hiring for the Christmas holidays at this time of year.
At the same time, superstorm Sandy distorted weekly jobless claims, according to the U.S. Bureau of Labor Statistics, and may be doing the same to Gallup’s unemployment results. The presidential election may also have disrupted the job market for a few days in early November.
Taking seasonal factors into account, it appears that the unemployment rate has remained around 8.0% since May. This seems consistent with other general economic data showing the economy growing slowly, the most recent of these being the 0.3% decline in October retail sales.
-
President 2012: The Final Electoral College Map

The Romney campaign this afternoon conceded the last state (Florida) in play from Tuesday’s Presidential election.
In total, only two states from the McCain Vs. Obama race flipped red from blue in the Electoral College – Indiana and North Carolina.
President Obama won the election with a total of 332 ECV to Mitt Romney’s 206 ECV.
This is certainly different from my final map which narrowly had Romney beating the President. I was surprised and believe the Romney Campaign was surprised as well.
Poll assumptions, averages and calculations, most notably by Nate Silver at the New York Times 538 blog had the results more accurately predicted. Larry Sabato over at the University of Virginia also had some successful prognostications.
Look at Nate Silver’s Tipping Point Analysis graph – it lays out the work for the GOP in 2016.

The same key battleground states in the 2012 race may very well be in play. Of course, Hillary Clinton or New York Governor Cuomo will be the Democratic candidate and the Republicans will also choose another.
In order to flip more states red in the Electoral College and win the election, the Republicans must win more votes in Florida, Ohio, Colorado, Nevada, Virginia, Pennsylvania, Iowa, and perhaps Wisconsin.
There may be two approaches as noted by Silver and I concur.
The Republican Party will have four years to adapt to the new reality. Republican gains among Hispanic voters could push Colorado and Nevada back toward the tipping point, for example.
States like Wisconsin, New Hampshire and Iowa are overwhelmingly white – but also highly educated, with fairly progressive views on social policy. If Republicans moderated their tone on social issues, they might be more competitive in these states, while regaining ground in Northern Virginia and in the Philadelphia suburbs.
The Republican Party has a few months to adapt and adopt new messaging to prepare for the 2014 mid-term elections.
The data is there and now it is up to the GOP to make the necessary changes.
-
President 2012 Polling: The Best National Pollsters

Graphic courtesy of John Sides at The Monkey Cage
As you know, I am really into polling since it gives us a scientific method to measure what is happening in the political world.
So, let’s take a look at who did the best.
This list and the graphic above is for the NATIONAL Presidential polls for 2012.
1. PPP (D)
1. Daily Kos/SEIU/PPP
3. YouGov
4. Ipsos/Reuters
5. Purple Strategies
6. NBC/WSJ
6. CBS/NYT
6. YouGov/Economist
9. UPI/CVOTER
10. IBD/TIPP
11. Angus-Reid
12. ABC/WP
13. Pew Research
13. Hartford Courant/UConn
15. CNN/ORC
15. Monmouth/SurveyUSA
15. Politico/GWU/Battleground
15. FOX News
15. Washington Times/JZ Analytics
15. Newsmax/JZ Analytics
15. American Research Group
15. Gravis Marketing
23. Democracy Corps (D)
24. Rasmussen
24. Gallup
26. NPR
27. National Journal
28. AP/GfKAs everyone, particularly on the right, started criticizing polling models, it drew attention to sampling and methodology. This is a good thing.
Often campaigns use a recently release poll (even if an outlier) to spin a meme of momentum for their candidate or a lack therof for their opponent.
Polling averages like Nate Silver’s and Real Clear Politics help aggregate the myriad of national and state oriented polls. I have found it best to look at the averages and it smooths out the results.
The pollsters WERE pretty accurate – some better than others.
-
President 2012: Latest Key Battleground State Polls for November 5
 Here are the latest key battleground state polls:
- Florida: Romney 52%, Obama 47% (InsiderAdvantage)
- Florida: Obama 50%, Romney 49% (Public Policy Polling)
- Florida: Romney 50%, Obama 48% (Pulse Opinion Research)
- North Carolina: Obama 49%, Romney 49% (Public Policy Polling)
- Ohio: Obama 48%, Romney 46% (Pulse Opinion Research)
- Pennsylvania: Obama 49%, Romney 46% (Pulse Opinion Research)
- Virginia: Obama 48%, Romney 47% (NBC/WSJ/Marist)
- Virginia: Obama 49%, Romney 48% (Pulse Opinion Research)
- Wisconsin: Obama 49%, Romney 48% (Pulse Opinion Research)
The Real Clear Politics average of polls and more are here.
As I have been saying for about a week now – the Presidential race is very close and we will be in for an exciting night of election returns.
If the polls are correct, then we will be in for a very late night Tuesday and early morning Wednesday.
-
President 2012: Latest Key Battleground State Polls for November 1

Mitt Romney campaigning yesterday in Florida
Here are the latest key battleground state polls:
- Colorado: Romney 50%, Obama 47% (Rasmussen)
- Florida: Obama 47%, Romney 47% (Newsmax/Zogby)
- Iowa: Obama 50%, Romney 44% (NBC/WSJ/Marist)
- Michigan: Obama 53%, Romney 45% (Public Policy Polling)
- Nevada: Obama 50%, Romney 46% (SurveyUSA)
- New Hampshire: Obama 49%, Romney 47% (NBC/WSJ/Marist)
- Ohio: Obama 50%, Romney 44% (Newsmax/Zogby)
- Virginia: Obama 49%, Romney 46% (Public Policy Polling)
- Virginia: Romney 48%, Obama 47% (Newsmax/Zogby)
- Wisconsin: Obama 49%, Romney 46% (NBC/WSJ/Marist)
- Wisconsin: Obama 49%, Romney 49% (Rasmussen)
The Real Clear Politics average of polls and more are here.
The Presidential race is very close – no matter what the spin spews out over the next few days.
This election can break either way and we may have a very exciting election night next Tuesday.
-
Poll Watch: Romney Takes the Lead in the Electoral College for First Time

For the first time, Real Clear Politics and their poll averages has Mitt Romney beating President Obama in the Electoral College.
The map is similar to my map from several months ago.

This map is from the interactive site, 270towin.com
But, what is interesting is that a number of states that many have thought in the Team Obama camp, may be in play – most notably Pennsylvania and Michigan.
The battleground state polls after the Monday night debate, should deliver a clearer picture of what will happen on November 6th.
By the way, the magic number of Electoral College votes to win is 270.
-
Gallup: Mid-October U.S. Unemployment Rate Falls to 7.3 Per Cent

According to the latest Gallup Poll.
U.S. unemployment, as measured by Gallup without seasonal adjustment, is 7.3% in mid-October, down considerably from 7.9% at the end of September and at a new low since Gallup began collecting employment data in January 2010. Gallup’s seasonally adjusted unemployment rate is 7.7%, also down from September. October’s adjusted mid-month measure is also more than a percentage point lower than October 2011.
These results are based on Gallup Daily tracking surveys conducted by landline and cell phone with more than 30,000 U.S. adults from Sept. 16-Oct. 15. Gallup’s seasonally adjusted unemployment rate incorporates the .04 upward adjustment used by the U.S. Bureau of Labor Statistics (BLS) in October of last year. The adjustment for September was an increase of .02, which explains the .04 drop in seasonally adjusted employment despite the .06 decline in the unadjusted number.
Good news for Americans.
Underemployment is also down.
Gallup’s U.S. underemployment measure combines the unemployed with those working part time but wanting full-time work. The underemployment rate is at its lowest mid-month or monthly level Gallup has measured since it began collecting employment data in 2010.
Here is the chart:
 What does this mean?
Remember this is Gallup’s own polling and is not the official goverment Bureau of Labor Statistics which will later this month have the official unemployment rate figures.
There are three weeks left to the Presidential campaign and while this downward trend is substantial, it may be too little and too late to affect positively the public perception that the American economy is improving.
The decline in unemployment but uptick in the number of Americans working part time but looking for full-time work is likely the result of seasonal hiring, which picks up in the fall for Halloween and continues through the end of the holiday season. Still, seasonally adjusted employment, which accounts for these types of periodic fluctuations, has declined modestly since the end of September. This is a promising sign that employers are adding jobs that will last into the new year.
Gallup’s mid-month unemployment numbers are a good early predictor of the monthly numbers released by the BLS. The decline in Gallup’s unadjusted and adjusted employment rate suggests that the BLS may report another decline when it releases the October data on Nov. 2.
-
Gallup Poll: Obama Losing Momentum With Voters
 President Obama’s loss of momentum traces back to the first Presidential debate when Mitt Romney schooled the President. But, the latest Gallup Poll is even more telling.
Half of likely voters now prefer Mitt Romney for president and 46% back President Barack Obama in Gallup interviewing through Monday.
While Romney’s four-percentage-point advantage is not statistically significant, he has consistently edged ahead of Obama each of the past several days in Gallup’s seven-day rolling averages conducted entirely after the Oct. 3 presidential debate. Prior to that debate — regarded as a decisive Romney win by political experts and Americans who watched it — Romney averaged less than a one-point lead over Obama among likely voters.
The latest result, from Oct. 9-15, is based on 2,723 likely voters drawn from more than 3,100 registered voters.
And, here is the registered voters poll chart – note the trend.
 Gallup has also done a comparison between Obama Vs. McCain and Obama Vs. Romney.
Here is the chart:
 Here is the summary of the differences between 2008 and 2012:
Degreed voters backing off Obama: In 2008, Obama led McCain among postgraduate educated voters by a 30-point margin, while he ran roughly even with McCain among those with lower levels of education. Today, Obama’s postgraduate advantage has been cut to 14 points and he trails Romney among college graduates (those with four-year degrees only) by 22 points. His support from high school graduates and those with some college is also down slightly, providing no counterbalance to his major losses among the college educated.
Southern losses: The South gave Obama the least support of any region in 2008, but still split their vote evenly for Obama vs. McCain. Today, Southerners favor Romney by a 22-point margin, the largest shift of any region. Voters in the East are also less supportive, while preferences in the West and Midwest are little changed.
Young voters stick with him: Young voters were an important part of Obama’s 2008 coalition, and in 2012 they continue to support him overwhelmingly, at roughly the same level as four years ago. The difficulty for Obama is that he currently has less support among each older age group, particularly those aged 30 to 49 years.
White support dwindles: Obama lost the white vote in 2008 by 12 percentage points, but that was more than offset by a 72-point lead among nonwhites. Today, Obama has a more daunting 22-point deficit among whites, while his margin over Romney among nonwhites is essentially unchanged.
Men move away: In 2008, Gallup found a 14-point swing in gender preferences for president, with women favoring Obama by a 14-point margin and men tied in their preferences for Obama vs. McCain. Today, there is a 20-point gender gap. Women’s support for Obama shrank to six percentage points, while men favor Romney by 14 points.
So, what does this all mean?
The President is in trouble for re-election. Mitt Romney has been surging since the first Denver Presidential debate and if Obama does not reverse this course in three weeks there will be a new President come 2013.
Watch the President come out swinging in tonight’s debate.
Obama really has to hit a home run or he is toast.


