-
Poll Watch: Unemployment Remains at 2010 Levels – Underemployment Remains High
 According to the latest Gallup Poll.
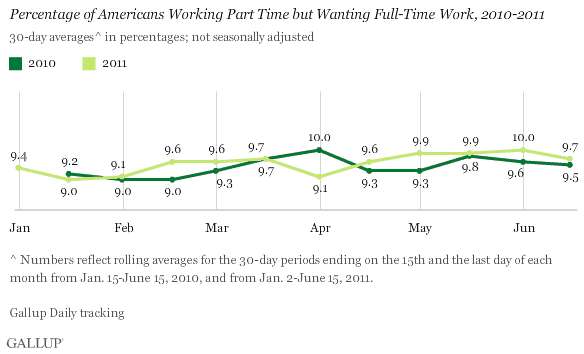
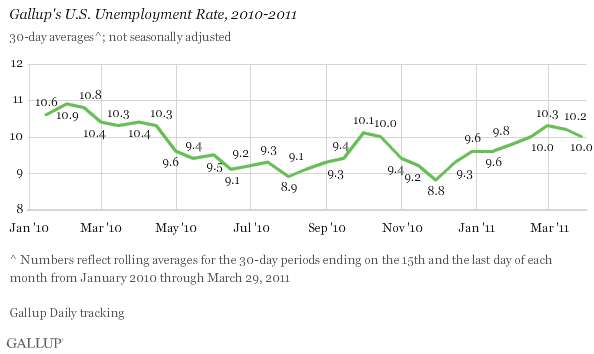
Unemployment, as measured by Gallup without seasonal adjustment, is at 8.9% in mid-June — down from 9.2% at the end of May and 9.1% in mid-June a year ago.
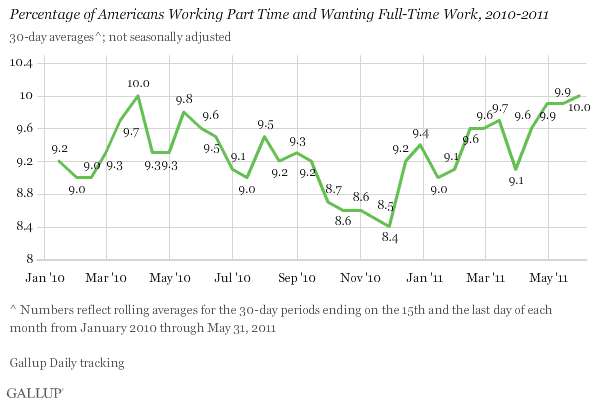
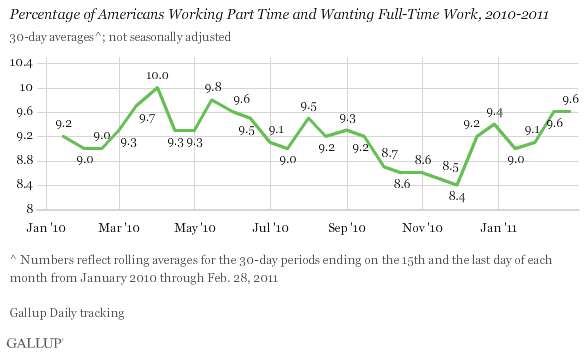
The percentage of part-time workers who want full-time work is 9.7%.
And, underemployment is down slightly but still as high as in mid-June 2010. Underemployment is a measure that combines the percentage of unemployed with the percentage working part-time but want full-time work.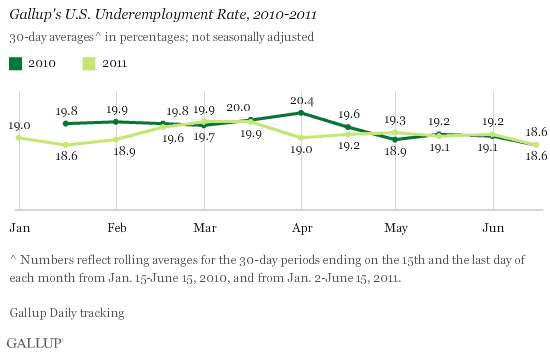 So, what does this all mean?
Although there is a small improvement in American unemployment, the unemployment rate remains high – around 2010 levels. Underemployment has not improved since last year. And, since last year’s rates were improving like 2011, this may be due to seasonal employment, which means the job market is flat.
Not a good report for the Obama Administration and the President’s re-election campaign.
Gallup’s U.S. unemployment and underemployment data indicate a modest improvement in job market conditions in mid-June compared with the end of May. This may partly result from a seasonal increase in employer hiring; Gallup’s data do not adjust for such changes. Still, underemployment remains at 2010 levels.
However, unemployment and underemployment tend to lag economic activity. Gallup’s employment data from the second quarter of the year are consistent with the modest 1.8% U.S. GDP growth in the first quarter of 2011. But Gallup’s measures did not show the improvement suggested by the government’s unemployment numbers earlier this year or the deterioration during April and May. Instead, they have shown the 2011 unemployment situation to be similar to that of 2010.
-
Video: Is Washington Creating Our Jobs Crisis?
What do you think?
President Obama and the Congressional Democrats OWN the economy. They fiddled around with Climate Change, a wasteful Economic Stimulus Bill and ObamaCare while American businesses burned.
American voters will hold them accountable.
-
President 2012: Chronic Unemployment Worse Than Great Depression
This will be the number one issue in the Presidential race of 2012 – unemployment.
About 6.2 million Americans, 45.1 percent of all unemployed workers in this country, have been jobless for more than six months – a higher percentage than during the Great Depression.
The bigger the gap on someone’s resume, the more questions employers have.
“(Employers) think: ‘Oh, well, there must be something really wrong with them because they haven’t gotten a job in 6 months, a year, 2 years.’ But that’s not necessarily the case,” said Marjorie Gardner-Cruse with the Hollywood Worksource Center.
The problem of course is the economy, but some industries, especially certain manufacturing jobs, are not ever expected to come back. Experts say unemployed workers need to be prepared to change careers.
“That person has to realize that, discover what field they want to work in, become trained and find a job in that field,” said Jerry Nickelsburg, Sr., an economist at UCLA.
Here’s another problem: more than 1 million of the long-term unemployed have run out of unemployment benefits, leaving them without the money to get new training, buy new clothes, or even get to job interviews.
If the GOP nominates a half-way decent candidate, President Obama will have a hard time persuading voters that he has done a job deserving re-election.
-
Poll Watch: Unemployment Stagnant in May

According to the latest Gallup Poll.Unemployment, as measured by Gallup without seasonal adjustment, stood at 9.2% at the end of May — unchanged from mid-May and down slightly from 9.4% at the end of April. It is also slightly lower than it was at the same time last year (9.5%
And, the graph of Americans working part-time and wanting full-time work – also unchanged in May.
Then, there is the underemployment rate:
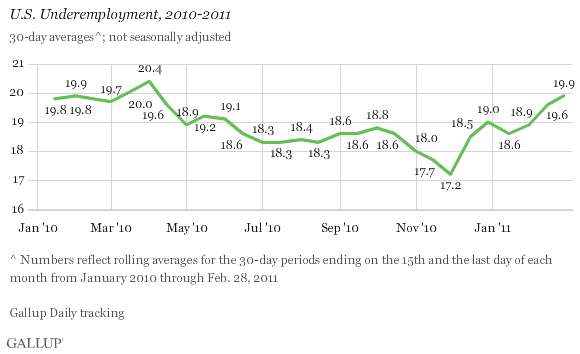
Underemployment — which includes both part-time workers wanting full-time employment and the unemployed — has remained flat since mid-March. Underemployment was 19.2% at the end of May, unchanged from 19.3% a month ago and 19.1% a year ago.
The graph:
But, job seekers are no more hopeful about finding work as compared with a year ago.Job seekers’ attitudes mirror Gallup’s stagnant employment data. In May, 46% of the underemployed reported being hopeful they would find work in the next four weeks. This number is identical to the 46% reporting hope in May 2010. Hope among the unemployed was 53% in both May 2010 and May 2011. Part-timers continue to be more pessimistic than the unemployed about the potential to find work in the next four weeks (40% in 2010 vs. 41% in 2011).
The graph:

So, what does this all mean?
With the GOP Presidential candidates announcing their runs for the White House today and over the next few weeks, President Obama cannot claim improvement in unemployment. He cannot claim a better economy as unemployment remains stagnant.
With unemployment remaining high, historically, it will be more difficult for the President to make the case for re-election.
Gallup’s measures of unemployment and underemployment are little changed in comparison with May 2010. Year-to-year comparisons provide the clearest picture of true changes in the rates because of seasonal variation in employment. Gallup data have seen some significant year-to-year declines in unemployment and underemployment in 2011, but not the consistent pattern of significant decline seen in the U.S. Bureau of Labor Statistics data, in both unemployment and U-6.
Gallup’s data seem to indicate that despite unemployment declines reported by the government, the American workforce has yet to feel a stable improvement in the jobs climate.
-
Poll Watch: U.S. Unemployment Falls to 9.4% But Underemployment Increases to 19.3%

According to the latest Gallup Poll.Unemployment, as measured by Gallup without seasonal adjustment, fell to 9.4% at the end of April from 9.6% in mid-April and 9.9% at the end of March. Unemployment is now at its lowest level of 2011 and is lower than the 9.6% at the end of April last year.
So, should Americans be reassured that the economy is turning around?
Well, perhaps, since a broader unemployment measure remained high in April.
The decline in unemployment since late March was not enough to offset the increase in those working part time but wanting full-time work. As a result, the combined underemployment measure was 19.3% at the end of April — essentially the same as the 19.2% in mid-April and slightly higher than the 19.0% at the end of March. Underemployment is now higher than the 18.9% at the end of April a year ago.
Here is the graph:

While the unemployment rate has decreased a little, there are more Americans only working part-time while they desire full-time work. Some work is better than no work but the implications are clear – people will remain disgruntled – especially at the ballot box.
There has been a relatively modest decline in unemployment over the first four months of 2011, and that improvement may be at least partly the result of seasonal hiring factors. There was a similar downward trend in Gallup’s not-seasonally adjusted unemployment measure over the same four-month period in 2010. This similarity in trends also holds for Gallup’s Job Creation Index and broader underemployment over the same time frames.
These trends are consistent with the Challenger report for April that showed fewer workers being let go than in March and slightly fewer than in April a year ago, and the ADP report that found a less-than-expected 179,000 increase in private-sector hiring during April. While layoffs are down, businesses continue to hold back on their hiring in the U.S.
Although the jobs situation has been relatively flat in 2011 — not much better than in 2010 and with an increasing number of people working part time but wanting full-time work — even marginal job growth is good, given the slow growth of the first quarter of this year. At a time when the U.S. economy is facing numerous economic headwinds, including plummeting consumer confidence and soaring food and gas prices, the challenge may be to maintain this performance during the months ahead.
-
The Share of Americans Working Has Fallen to Lowest Level in Three Decades
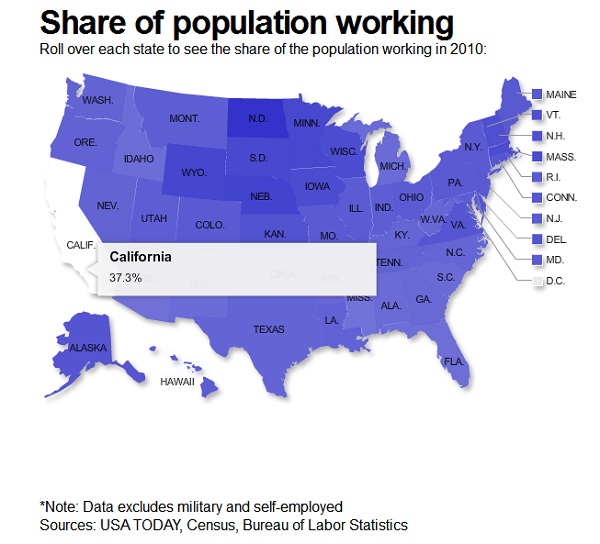 According to the latest numbers from USA Today.
Only 45.4% of Americans had jobs in 2010, the lowest rate since 1983 and down from a peak of 49.3% in 2000. Last year, just 66.8% of men had jobs, the lowest on record.
The bad economy, an aging population and a plateau in women working are contributing to changes that pose serious challenges for financing the nation’s social programs.
Another change: the bulk of those not working has shifted from children to adults.
In 2000, the nation had roughly the same number of children and non-working adults. Since then, the population of non-working adults has grown 27 million while the nation added just 3 million children under 18.
The numbers for California are worse – 37.3%
And, these numbers will drive the policy discussions about the economy, jobs and entitlement programs for the baby boom generation.
Other key findings:
•Men leave. Working-age men have been dropping out of the labor force for decades. The disappearance quickened when construction and manufacturing jobs vanished in the recession from December 2007 through June 2009. Until the 1960s, more than 80% of men worked.
•Women stay. The trend of women getting jobs offset the loss of working men until the late 1990s. The share of women holding jobs rose from 36% in 1960 to 57% in 1995, then leveled off. The rate was 56% in 2010.
-
Poll Watch: U.S. Unemployment Rate is 10% in March – Down From February – But So What?
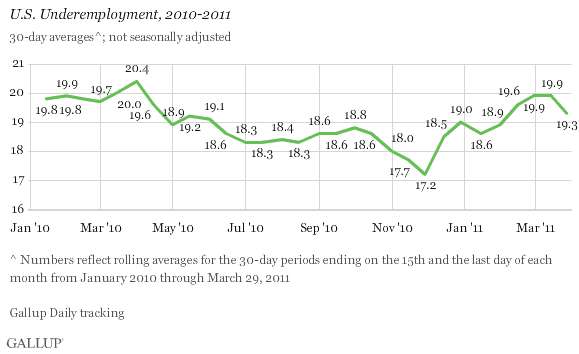
America’s unemployment rate was down in March 2011 and down from March 2010 as measured by Gallup.Unemployment, as measured by Gallup without seasonal adjustment, was 10.0% in March — down from 10.2% in mid-March and 10.3% at the end of February, but above the 9.8% at the end of January. U.S. unemployment was 10.4% at the end of March a year ago.
What about the percentage of part-time workers?
And, underemployment also declined in March.
But, what does this mean? Is America’s economy improving?
Not according to Gallup.
ADP on Wednesday reported that U.S. private-sector jobs increased by 201,000 in March — the third consecutive month at this level of job growth. At the same time, Challenger, Gray & Christmas showed a sharp decline in March U.S. layoffs compared with last year. All of this is consistent with Gallup’s Job Creation Index, which has shown slightly more jobs being created and comparatively low layoffs during the first quarter of 2011.
However, contrary to the federal government’s recent job reports, Gallup’s unemployment and underemployment measures suggest that recent job increases have not been sufficient to significantly improve the jobs situation so far in 2011. Although both of Gallup’s measures were marginally better in March, they remain higher now than they were in January.
The March improvement in the jobs situation compared with February may be partly the result of seasonal hiring patterns, with companies increasing their hiring at this time of year. However, the 2010 jobs situation didn’t show substantial improvement until the second half of April. Regardless, the decline in the underemployment rate year-over-year is consistent with a cautious hiring approach in which employers avoid layoffs while taking on more part-time workers and limiting their hiring of full-time employees.
Despite the March uptick, Gallup’s view of the U.S. jobs situation remains substantially less optimistic than the government’s recent unemployment report might suggest. Added to this, late March Gallup Daily tracking results show a continuing decline in economic optimism, a pullback in consumer spending, and a drop in Gallup’s Job Creation Index. This suggests that recent behavior on Main Street does not reflect the government’s rosier assessment. It also implies that the recent marginal improvement Gallup finds may be more temporary than one might hope.
Looks like the Obama Administration is spinning the numbers to creat some economic optimism but too many Americans remain out of work and economic activity remains stagnant at best.
-
Poll Watch: Underemployment 21% or Higher In Nine States Including California
View underemployment data for every state
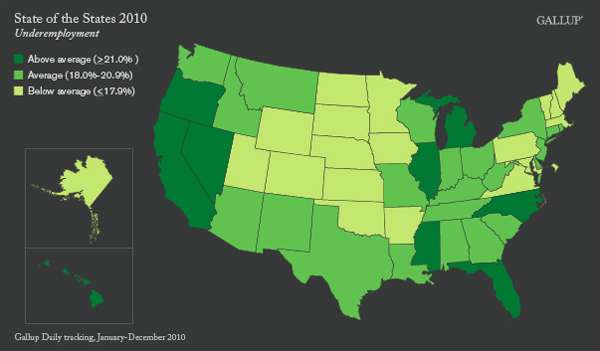
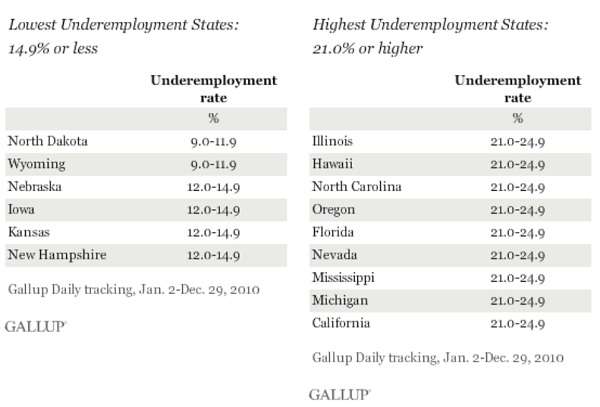
Despite the U.S. Bureau of Labor Statistics report today, Gallup raises another issue that may loom as more important – UNDEREMPLOYMENT.Underemployed Americans are generally those who are not working to their desired capacity. Gallup considers respondents to be “underemployed” if they are either 1) unemployed or 2) employed part time (under 30 hours per week) and wish to be employed full time. The definition of unemployment used as a component of underemployment closely follows the government’s definition; respondents are “unemployed” if they don’t have a job, and are actively looking for work and are available to begin work. Gallup reports underemployment by state in the following ranges: 9.0%-11.9%, 12.0%-14.9%, 15.0%-17.9%, 18.0%-20.9%, and 21.0%-24.9%.
The nine states with underemployment rates of 21% or higher were relatively spread out across the country and include the nation’s largest state, California, as well as Michigan and Nevada, which have been hit by downturns in the automotive and gambling industries, respectively. Twenty-two states cluster in the underemployment range of 18% to 20.9%, relatively close to the 18.9% national average.
Here are the charts:
 So, what does this mean?
Although the national unemployment rates are marginally decreasing, there is a large population of Americans that are not working enough. This is a measure of the real impact of the job situation and will have political implications – particularly in key battleground states as the campaigns for 2012 begin. Note the states of North Carolina, Nevada, Florida and Michigan are on the highest underemployment list.
Underemployment is a measure of the real impact of the job situation in the U.S., taking into account as it does workers who are out of and explicitly looking for work, as well as those who may be working part time but would like to work full time. The extent of underemployment in the U.S. varies widely by state, from relatively low levels in the energy states of North Dakota and Wyoming to quite high levels in a number of states, including the nation’s largest, California.
-
U.S. Employment Rate Drops to 8.9%, 192,000 Jobs Added – Spinning the Numbers?
 My read on the economy is not as optimistic as the unemployment numbers which came out of the U.S. Bureau of Labor Statistics today. I mean, look at Gallup’s numbers that I posted just the other day above.
Nonfarm payroll employment increased by 192,000 in February, and the unemployment rate was little changed at 8.9 percent, the U.S. Bureau of Labor Statistics reported today. Job gains occurred in manufacturing, construction, professional and business services, health care, and transportation and warehousing.
The number of unemployed persons (13.7 million) and the unemployment rate (8.9 percent) changed little in February. The labor force was about unchanged over the month. The jobless rate was down by 0.9 percentage point since November 2010. (See table A-1.)
Among the major worker groups, the unemployment rates for adult men (8.7 percent), adult women (8.0 percent), teenagers (23.9 percent), whites (8.0 percent), blacks (15.3 percent), and Hispanics (11.6 percent) showed little or no change in February. The jobless rate for Asians was 6.8 percent, not seasonally adjusted. (See tables A-1, A-2, and A-3.)
The number of job losers and persons who completed temporary jobs, at 8.3 million, continued to trend down in February and has fallen by 1.2 million over the past 12 months. The number of long-term unemployed (those jobless for 27 weeks or more) was 6.0 million and accounted for 43.9 percent of the unemployed. (See tables A-11 and A-12.)
Both the civilian labor force participation rate, at 64.2 percent, and the employ- ment-population ratio, at 58.4 percent, were unchanged in February. (See table A-1.) The number of persons employed part time for economic reasons (sometimes referred to as involuntary part-time workers) was essentially unchanged at 8.3 million in February. These individuals were working part time because their hours had been cut back or because they were unable to find a full-time job. (See table A-8.)
In February, 2.7 million persons were marginally attached to the labor force, up from 2.5 million a year earlier. (These data are not seasonally adjusted.) These individuals were not in the labor force, wanted and were available for work, and had looked for a job sometime in the prior 12 months. They were not counted as unemployed because they had not searched for work in the 4 weeks preceding the survey. (See table A-16.)
Among the marginally attached, there were 1.0 million discouraged workers in February, a decrease of 184,000 from a year earlier. (These data are not seasonally adjusted.) Discouraged workers are persons not currently looking for work because they believe no jobs are available for them. The remaining 1.7 million persons marginally attached to the labor force in February had not searched for work in the 4 weeks preceding the survey for reasons such as school attendance or family responsibilities. (See table A-16.)
Any improvement is good but the numbers, while the MSM spins them to support the Obama administration and the GOP spinners take credit for their policy changes in the Congress, are still dire.
The number of unemployed people dipped to 13.7 million, still nearly double the number before the recession began in December 2007.
This report while encouraging should be read with a grain of salt.
To cut that in half at this rate (or just to take off 6.5 million), assuming 100K each month to keep up with population growth, we would need 71 months to get unemployment back to its pre-recession level. And we would need that on a consistent basis, not 36K one month and 192K the next.
-
Poll Watch: U.S. Unemployment Increases to 10.3% in February – Jobs Situation Worsens
According to the latest poll numbers from Gallup.Unemployment, as measured by Gallup without seasonal adjustment, hit 10.3% in February — up from 9.8% at the end of January. The U.S. unemployment rate is now essentially the same as the 10.4% at the end of February 2010.
And, the percentage of part-time workers who desire full-time work has surged.
And, underemployment surged in February:
 All in all, a pretty dire picture of the American economy which will have political effects as Republican challengers to President Obama begin to gear up for the Presidential race in 2012.
There is essentially no difference between the unemployment rate now and the one at this time a year ago; January’s rate, in contrast, showed a 1.1-percentage-point year-over-year improvement. This suggests that the real U.S. jobs situation worsened in February. That is, jobs are relatively less available now than in January.
In the broader underemployment picture, the situation is much the same. January’s year-over-year improvement of 1.0 points became -0.2 points in February. In turn, this suggests job market conditions in terms of underemployment also worsened during February.
This deterioration in the jobs situation combined with surging gas prices, budget battles at the federal and state level, and declines on Wall Street tend to explain the recent plunge Gallup recorded in consumer confidence. They also align with the continued “new normal” spending patterns of early 2011. Although Gallup’s Job Creation Index has improved over the past year and showed modest improvement in February, the improvement has not been significant enough to positively affect underemployment and unemployment.