-
Flap’s Links and Comments for June 2nd on 11:02
These are my links for June 2nd from 11:02 to 11:42:
- California State Senate approves bill allowing counties to raise vehicle fees – Individual counties could vote to raise vehicle fees under a bill that earned Senate approval today.
"This gives counties a tool they currently don't have in a time of crisis," said bill author Mark Leno, D-San Francisco.
In 2003, Gov. Arnold Schwarzenegger dropped the rate of what essentially is an annual tax on a vehicle's present value. The rate change from 2 percent to 0.65 percent took away a chunk of revenues counties relied on to pay for public safety and social services. A temporary increase to 1.15 percent went into effect in May 2009 and expires at the end of this month. Gov. Jerry Brown's budget plan calls for moving the expiration to 2016.
The proposal that passed the Senate by a 23-15 vote today allows a county board of supervisors, with a two-thirds vote, to authorize a vote for higher fees on county residents. If a majority of county voters signs off on the plan, their vehicle fee effectively would return to the original 2 percent rate.
Leno introduced the same bill last year, but it did not clear the Assembly floor.
Automobile manufacturers and dealers are opposed to attaching fees to vehicles, saying there's already a long list of hidden government costs.
None of the Republicans present voted for Leno's bill.
"This is another example of the insatiable appetite we have for raising taxes around this building," Sen. Bob Huff, R-Diamond Bar, said on the Senate floor.
Senate Bill 223 is one of several measures moving through the Legislature with a goal of giving local officials a chance to collect more revenues. The most high-profile proposal has been Senate Bill 653 by Sen. President Pro Tem Darrell Steinberg.
======
A tax is a tax to Californians – either from the state or the county.
- Job Data May Be Key to Obama’s Job – No American president since Franklin Delano Roosevelt has won a second term in office when the unemployment rate on Election Day topped 7.2 percent.
Seventeen months before the next election, it is increasingly clear that President Obama must defy that trend to keep his job.
Roughly 9 percent of Americans who want to go to work cannot find an employer. Companies are firing fewer people, but hiring remains anemic. And the vast majority of economic forecasters, including the president’s own advisers, predict only modest progress by November 2012.
The latest job numbers, due Friday, are expected to provide new cause for concern. Other indicators suggest the pace of growth is flagging. Weak manufacturing data, a gloomy reading on jobs in advance of Friday’s report and a drop in auto sales led the markets to their worst close since August, and those declines carried over into Asia Thursday.
======
Read it all
It is all about the economy going into the Presidential race of 2012.
- Why Barack Obama may be heading for electoral disaster in 2012 – To say this has been an extremely bad week for the Obama administration on the economic front would be a serious understatement. As The Wall Street Journal reported on Wednesday, home prices in the United States have sunk to their lowest levels since 2002, falling 4.2 percent in the first quarter of 2011. At the same time, employment growth is stalling, with only 38,000 Americans added to the workforce in May, the smallest increase since September. This compares with 179,000 jobs added in April. There has also been a steep slowdown in the manufacturing sector, and a downturn in the stock market on the back of weak economic news.
Bill Clinton’s labour secretary Robert Reich summed up the grim mood in a hard-hitting op-ed in The Financial Times, which took aim at both the administration and Congress:
The US economy was supposed to be in bloom by late spring, but it is hardly growing at all. Expectations for second-quarter growth are not much better than the measly 1.8 per cent annualised rate of the first quarter. That is not nearly fast enough to reduce America’s ferociously high level of unemployment… Meanwhile, housing prices continue to fall. They are now 33 per cent below their 2006 peak. That is a bigger drop than recorded in the Great Depression. Homes are the largest single asset of the American middle class, so as housing prices drop many Americans feel poorer. All of this is contributing to a general gloominess. Not surprisingly, consumer confidence is also down.
=====
Read it all
- California State Senate approves bill allowing counties to raise vehicle fees – Individual counties could vote to raise vehicle fees under a bill that earned Senate approval today.
-
Poll Watch: Unemployment Stagnant in May

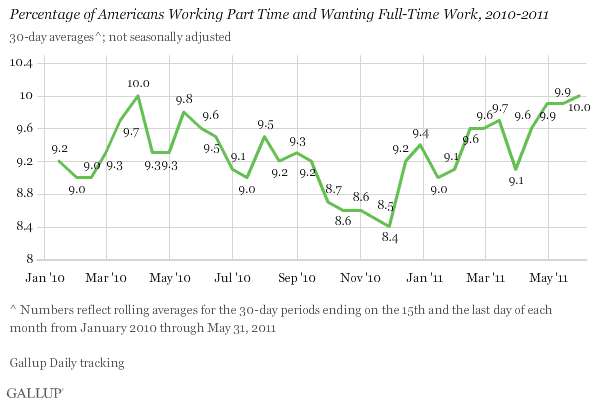
According to the latest Gallup Poll.Unemployment, as measured by Gallup without seasonal adjustment, stood at 9.2% at the end of May — unchanged from mid-May and down slightly from 9.4% at the end of April. It is also slightly lower than it was at the same time last year (9.5%
And, the graph of Americans working part-time and wanting full-time work – also unchanged in May.
Then, there is the underemployment rate:
Underemployment — which includes both part-time workers wanting full-time employment and the unemployed — has remained flat since mid-March. Underemployment was 19.2% at the end of May, unchanged from 19.3% a month ago and 19.1% a year ago.
The graph:
But, job seekers are no more hopeful about finding work as compared with a year ago.Job seekers’ attitudes mirror Gallup’s stagnant employment data. In May, 46% of the underemployed reported being hopeful they would find work in the next four weeks. This number is identical to the 46% reporting hope in May 2010. Hope among the unemployed was 53% in both May 2010 and May 2011. Part-timers continue to be more pessimistic than the unemployed about the potential to find work in the next four weeks (40% in 2010 vs. 41% in 2011).
The graph:

So, what does this all mean?
With the GOP Presidential candidates announcing their runs for the White House today and over the next few weeks, President Obama cannot claim improvement in unemployment. He cannot claim a better economy as unemployment remains stagnant.
With unemployment remaining high, historically, it will be more difficult for the President to make the case for re-election.
Gallup’s measures of unemployment and underemployment are little changed in comparison with May 2010. Year-to-year comparisons provide the clearest picture of true changes in the rates because of seasonal variation in employment. Gallup data have seen some significant year-to-year declines in unemployment and underemployment in 2011, but not the consistent pattern of significant decline seen in the U.S. Bureau of Labor Statistics data, in both unemployment and U-6.
Gallup’s data seem to indicate that despite unemployment declines reported by the government, the American workforce has yet to feel a stable improvement in the jobs climate.
-
Poll Watch: Job Creation Improving in American Economy?
 Yes, slightly according to the latest Gallup Poll.
Gallup’s Job Creation Index reached a new high of +13 in April. This does not differ much from the +12 of the prior two months, but well exceeds the +5 of April 2010.
And, where are the best areas of the country for jobs?
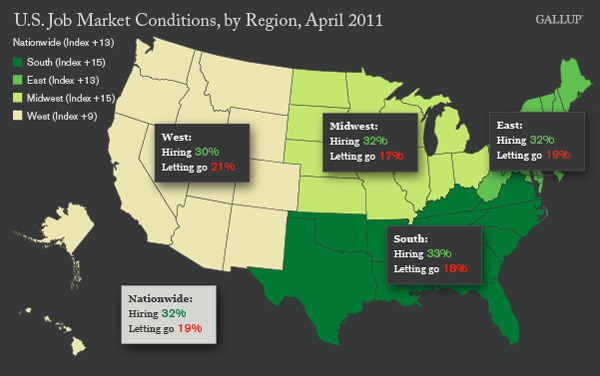 The South and the Midwest. The Western United States is lagging the rest of the country.
Here is the Hiring and Firing graph:
So, what does this all mean?
Politically, should the economy improve or if there is a perception that the economy is improving, it will benefit President Obama and his re-election efforts. But, we have to look at key battleground states where the election will actually be decided. It is the employment situation in those specific states that will be determinant.
The long-suffering job markets in the Midwest appear to be benefiting from continuing improvements in the manufacturing sector, and one of the benefits of the weak U.S. dollar has been to make U.S. exports more attractive globally. As a result, this region has the lowest firing in the nation and, along with the East, shows the most year-over-year improvement.
Still, increased manufacturing activity has been enough to stimulate only a modest improvement in job growth nationwide. Although technically hitting a new high in April, Gallup’s Job Creation Index suggests there has been a virtual stagnation of job market conditions over the past three months. This stagnation most likely reflects the slower economic growth of the first quarter that seems to have continued in April.
At the same time, the finding that job growth in April was consistent with that of February and March is not bad, given the current economic headwinds of surging food and gas prices.
-
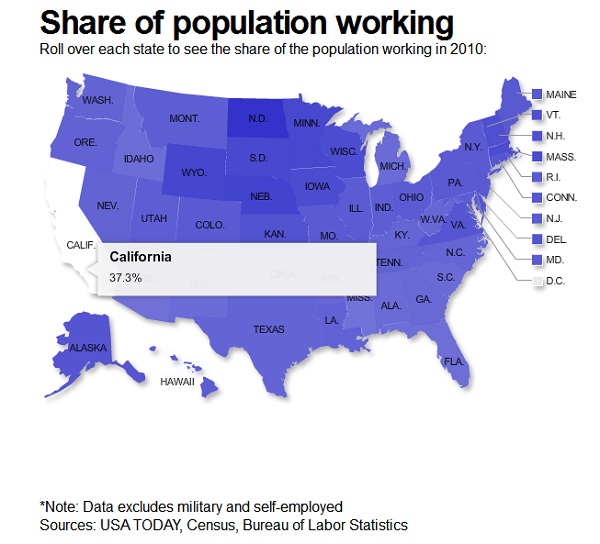
The Share of Americans Working Has Fallen to Lowest Level in Three Decades
 According to the latest numbers from USA Today.
Only 45.4% of Americans had jobs in 2010, the lowest rate since 1983 and down from a peak of 49.3% in 2000. Last year, just 66.8% of men had jobs, the lowest on record.
The bad economy, an aging population and a plateau in women working are contributing to changes that pose serious challenges for financing the nation’s social programs.
Another change: the bulk of those not working has shifted from children to adults.
In 2000, the nation had roughly the same number of children and non-working adults. Since then, the population of non-working adults has grown 27 million while the nation added just 3 million children under 18.
The numbers for California are worse – 37.3%
And, these numbers will drive the policy discussions about the economy, jobs and entitlement programs for the baby boom generation.
Other key findings:
•Men leave. Working-age men have been dropping out of the labor force for decades. The disappearance quickened when construction and manufacturing jobs vanished in the recession from December 2007 through June 2009. Until the 1960s, more than 80% of men worked.
•Women stay. The trend of women getting jobs offset the loss of working men until the late 1990s. The share of women holding jobs rose from 36% in 1960 to 57% in 1995, then leveled off. The rate was 56% in 2010.
-
Flap’s Links and Comments for April 14th on 06:00
These are my links for April 14th from 06:00 to 06:04:
- The Uneven Senate Landscape of 2012 (and 2014) – Republican won 24 of the 37 Senate contests last year, giving them a head start not only on winning a Senate majority in 2012 but possibly winning a 60-seat supermajority two years later.
They will need to net 26 or 27 of the remaining 67 contests over the next two cycles to win a majority in 2014, or 36 of the next 67 to get to 60 seats during the next midterm elections.
The Senate is always a different kind of numbers game than the House. With unbalanced classes, Senate control — to say nothing about a filibuster-proof majority — hinges on which party has more seats up for election in a particular election cycle.
When one of the political parties has a huge election night, as Republicans did last year, it automatically gives that party an opportunity to take over the Senate, whether two years later or four.
The 2012 Senate class includes 23 Democrats and only 10 Republicans, and the stunning imbalance means that Democrats will be on the defensive throughout the cycle unless the political environment shifts dramatically to their party.
======
Read all of Stuart Rothenberg's analysis.
The chances of GOP gains in the Senate in 2012 and 2014 look good.
- Jobless Claims Unexpectedly Rise; Inflation Pressure Grows – New claims for unemployment benefits unexpectedly rose last week, bouncing back above the key 400,000 level, while core producer prices clumbed faster than expected in March, government reports showed on Thursday.
Initial claims for state unemployment benefits rose 27,000 to a seasonally adjusted 412,000, the Labor Department said.
======
Obamanomics is a failure – just like Jimmy Carter.
A slow economy with high unemployment and inflation.
- The Uneven Senate Landscape of 2012 (and 2014) – Republican won 24 of the 37 Senate contests last year, giving them a head start not only on winning a Senate majority in 2012 but possibly winning a 60-seat supermajority two years later.
-
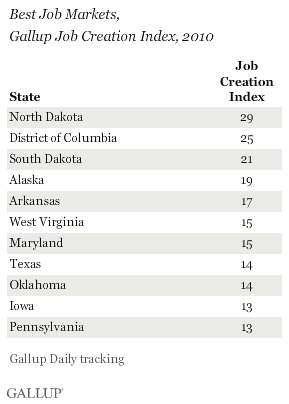
Poll Watch: The Best and Worst Job Markets in 2010 – Nevada and California some of the Worst
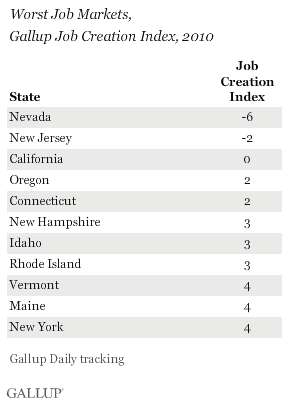 I am not surprised especially with regard to Nevada and California being poor job markets, according to the latest Gallup Poll.
More than half of the 10 best job markets in 2010 were in energy- and commodity-producing states. Most of the 10 states with the worst job markets consisted of finance states of the Northeast and the housing-depressed states of the West.
Having a significant presence of natural resource-based industries was a distinct job-creation advantage for states such as North Dakota, West Virginia, Oklahoma, and Texas. These were among the top 10 job markets in 2010, as they were in 2008 and 2009. Also among the top 10 in 2010 were Alaska — another energy state — and Washington, D.C., and Maryland, both of which benefit from having a large percentage of federal government workers. Mostly farm commodity states — including Arkansas, South Dakota, Iowa, and Pennsylvania — fill out the top 10.
What about improvement between 2009 and 2010?
States showing the most improvement in job market conditions between 2009 and 2010 included the long-depressed manufacturing states of Michigan, Ohio, and Pennsylvania — likely reflecting the significant improvement in U.S. manufacturing last year. Also among the most improved were 5 of the 10 states with the worst job markets in 2009, giving them the most room to improve: Oregon, Delaware, Arizona, Minnesota, along with Michigan. Reflecting the growth of the federal government, the District of Columbia was not only the second-best job market but also the second-most improved job market in 2010.
Eight of the states showing the least improvement last year were in the 10 best job markets in 2009, including New Mexico, Nebraska, West Virginia, Louisiana, Maryland, Oklahoma, Texas, and Virginia. Also among those showing the least improvement are several states in the Northeast — New Jersey, Vermont, and New York — and two smaller states in the West, Montana and Wyoming.
So, what does this mean politically?
It is noted that only two key battleground state in the Electoral College are listed – Nevada and Virginia. The other states are either very blue or very red which means these states in the extreme job markets will be ignored during the race for 2012.
Nevada’s unemployment rate, plus President Obama’s comments about Las Vegas may play well there for the GOP nominee but demographic changes (more Hispanic and union, Clark County voters) if they show up and vote may be too much to overcome.
Virginia is a state where the GOP will need to perform well if they wish to beat President Obama.
The GOP nominee will concentrate their campaign in other states which have poor unemployment numbers.
Gallup’s job creation index and job market conditions portend more of the same for 2011.
Gallup’s Job Creation Index averaged +7 nationwide during 2010, with 28% of employees reporting their companies were hiring and 21% saying their companies were letting people go. Regionally, job market creation was best in the Midwest and South but lagged behind in the East and West.
Looking ahead, it seems likely that the overall pattern of state job market conditions across the nation in 2011 will remain similar to those of the past three years. Energy prices are surging and gas is now $3.29 a gallon nationwide, compared with $2.69 a year ago. High oil prices tend to improve hiring activity in energy-producing states. Similarly, high commodity prices should help job conditions in the farm and mining states.
On the other hand, the housing market continues to suffer. This suggests that states with the worst housing conditions will continue to see relatively difficult job market conditions for some time.
Of course, it is possible that state and federal budget cutbacks could hurt job market conditions in some states more than others, particularly those having the worst budget problems, such as California, New York, and Illinois. Or, federal budget cuts could hurt states with a large number of federal government employees. Alternatively, U.S. manufacturing and exports could continue to increase, providing more jobs in industrial states.
All in all, not a good poll about jobs for the incumbent President and Democratic U.S. Senate incumbents going into election 2012.
-
Gallup: U.S. Unemployment Up Slightly to 9.8% in January
 This will not help President Obama as he prepares to run for re-election.
Unemployment, as measured by Gallup without seasonal adjustment, increased to 9.8% at the end of January — up from 9.6% at the end of December, but down from 10.9% a year ago.
Some political pundits maintain that if the unemployment rate does not decrease to below 8% that Obama will NOT win re-election. So far, economic conditions do not look favorable for him.
Comparing Gallup’s unemployment and underemployment rates so far in 2011 with those for the same periods in 2010 provides something of a seasonally adjusted view of Gallup’s jobs data. Unemployment and underemployment are now at least one point below the rates of a year ago, reflecting modest improvement over the past year.
Still, Gallup’s measures paint a real-time picture of the current job realities on the ground: nearly 1 in 10 Americans in the U.S. workforce are unemployed, nearly one out of five are underemployed, and the nation’s overall hiring situation has not improved over the past four to six months.