-
President 2012 Poll Watch: Obama Approval Up, But Below Other Presidents Who Were Re-Elected
 According to the latest Gallup Poll.
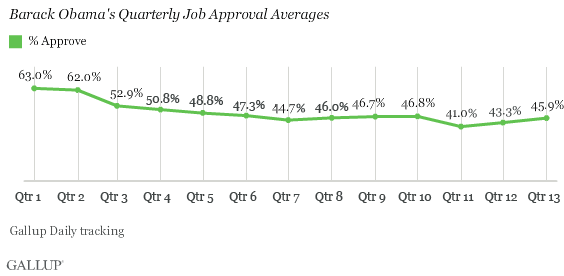
President Obama’s job approval rating averaged 45.9% during his 13th quarter in office, showing improvement for the second consecutive quarter. His rating is essentially back to where it was before declining last summer and fall.
These results are based on more than 45,000 Gallup Daily tracking interviews conducted from Jan. 20 through April 19, the 13th quarter Obama has been in office since he was inaugurated on Jan. 20, 2009.
The improvement in Obama’s approval rating is likely tied to more positive economic news in recent months, especially concerning unemployment. Obama’s approval rating reached as high as 50% in Gallup Daily tracking, for April 3-5, before settling back down into the mid- to high 40% range in recent days.
Although Obama’s approval rating is improving, this is offset by the fact that it remains below the averages at the same point in time for presidents who were re-elected. All presidents since Eisenhower who were re-elected enjoyed average approval ratings above 50% during their 13th quarters in office.
Here is the chart of the other President who were re-elected:
 The latest California unemployment numbers indicated that whatever economic recovery we have been experiencing lately may be short-lived. If American voters perceive the economy is not improving, President Obama will sink in the polls.
Obama remains short of the historical comfort zone — above 50% approval — that most successfully re-elected presidents achieved during their re-election year. However, he is not far below that threshold, and has seen his approval rating improve over the last two quarters.
The latest Gallup Daily tracking three-day rolling average of 46% suggests Obama is ending his 13th quarter at precisely his average performance for the entire quarter.
This means Mitt Romney has an opportunity.
-
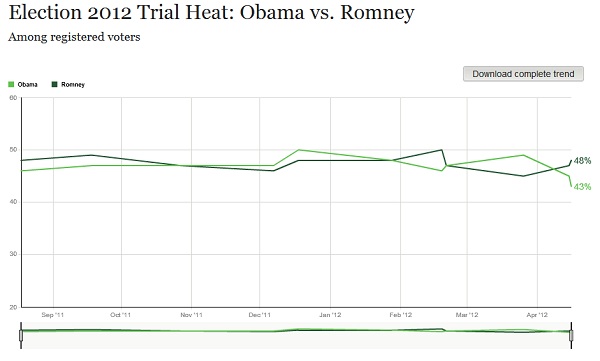
President 2012 Poll Watch: Romney 48% Vs. Obama 43%
 According to the latest Gallup Poll.
These are the results when registered voters are asked: “Suppose the presidential election were held today. If Barack Obama were the Democratic Party’s candidate and former Massachusetts governor Mitt Romney were the Republican Party’s candidate, who would you vote for Barack Obama, the Democrat or Mitt Romney, the Republican?” Those who are undecided are further asked if they lean more toward Obama or Romney and their leanings are incorporated into the results.
However, the latest Pew national poll has President Obama leading, but his lead has narrowed from the previous month.
But, what really matters is a few key battleground states and in one, President Obama is winning – Florida.
The polls are likely to fluctuate now as each national campaign ramps up their advertising programs.
-
President 2012 Poll Watch: Mitt Romney 46 Vs. Barack Obama 44%
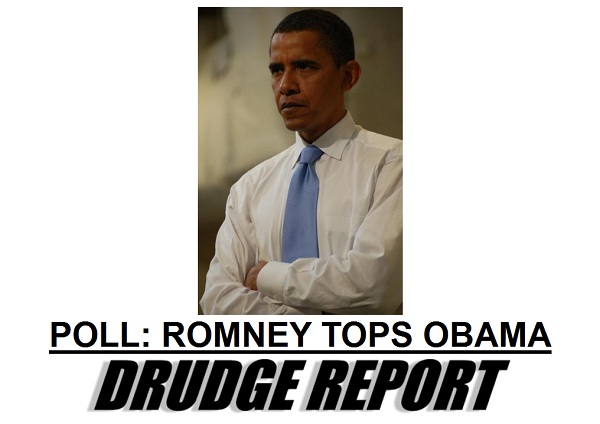
According to the latest Fox News Poll.Republican Mitt Romney holds a slim edge over President Obama in a head-to-head matchup, a Fox News poll released Thursday shows. In addition, the poll finds the president’s job rating has dropped to its lowest point of the year.
In a presidential matchup, Romney tops Obama by 46-44 percent if the election were today.
As with every Romney-Obama matchup in the past six months, the race is so tight that it is within the poll’s margin of sampling error. This, however, is only the second time the Fox News poll shows Romney on top. The first time was November 2011, when he was also up by 2 percentage points.
The poll was conducted Monday through Wednesday. On Tuesday, Rick Santorum suspended his presidential bid — giving Romney a clear path to the Republican nomination.
More Republicans (42 percent) than Democrats (32 percent) or independents (34 percent) say they are “extremely” interested in the upcoming presidential election.
Even so, the strength of party support in the matchup is dead even: 85 percent of Democrats back Obama and 85 percent of Republican back Romney.
Among the highly sought after group of independents, the poll found 43 percent back Romney and 37 percent Obama. Nearly one in four independent voters (21 percent) is undecided or won’t vote for either of the major party candidates. Last month, independents split evenly between Obama and Romney at 40 percent each. In February, Romney had a 9-point advantage.
The poll shows the gender gap may not solely be a problem for the Republican candidate. Women are more likely to back Obama (by 49-41 percent), while men are even more likely to give their support to Romney (by 52-38 percent). The 2008 Fox News national exit poll showed women voted for Obama over Republican John McCain by 13 percentage points (56-43 percent). Historically, exit poll results show women have consistently backed the Democrat over the Republican in presidential elections.
Now that Mitt Romney has clinched the Republican nomination, it is game on.
The Hilary Rosen flap may indeed hurt Obama enough that his female support may wane and any gender gap to his advantage may narrow.
Stay tuned…
-
President 2012 Colorado Poll Watch: Obama Leading Romney 53% Vs. 40%
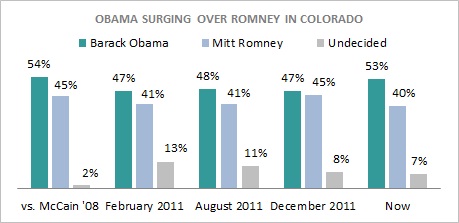
According to the latest PPP Poll.Barack Obama’s opened up a 13 point lead on Mitt Romney in Colorado at 53-40. He’s gained 11 points in the state since December when he led just 47-45.
The formula for Obama’s gains is the same in Colorado as it is everywhere. He’s getting more popular and Romney’s getting less popular. In December only 45% of voters approved of the job Obama was doing to 50% who disapproved. Now he’s on positive ground with 50% giving him good marks to 47% who think he’s doing a poor job. The main thing that’s changed is Democrats really rallying around him. In December he was at 76/18 with them, but now it’s 89/8. The party is getting a lot more unified as the election comes closer.
Romney’s headed in the other direction. His net favorability has gone from -18 (35/53) to an even worse -29 (31/60). Romney had a healthy amount of appeal to Democrats earlier with 20% viewing him favorably but that’s now down to 11%. And he’s extremely unpopular with independents at 25/65.
In the head to head between them Obama leads Romney by 26 points with independents at 57-31. And Romney’s now getting just 7% of the Democratic vote, down from 14% on our December poll. This is the trend we’re seeing in most states- the primary campaign has caused much of Romney’s crossover support to evaporate and it’s also making him lose ground with independents.
Romney’s problem with women shows itself in a major way in Colorado. He’s down by 24 points with them at 58-34. With men the race is actually tied. Obama’s also up by an astounding 72-17 margin with voters under 30 in the state, a pretty good sign of where Colorado is headed politically.I am not surprised and never considered Colorado a serious key battleground state. The only contested races appear to be in Ohio, Virginia, North Carolina, Nevada and Florida.
Mitt Romney will be an uninspired Republican nominee, but has a chance in those five states. A good media campaign and ground operation to turn out voters might lead him to a victory.
Otherwise, it will be on to 2016 for the GOP and Tea Party.
-
Gallup Poll Watch: U.S. Unemployment Rate Falls in March But…
 According to the latest Gallup Poll.
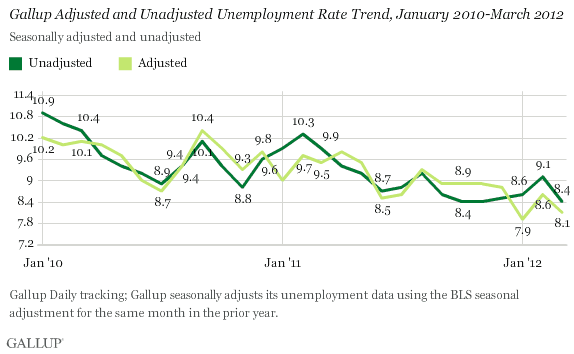
U.S. unemployment, as measured by Gallup without seasonal adjustment, declined to 8.4% in March from 9.1% in February, while Gallup’s seasonally adjusted rate fell to 8.1% from 8.6% in February.
These results are based on Gallup Daily tracking interviewing conducted in March, including interviews with 31,283 U.S. adults, 67.8% of whom are active in the workforce. Gallup’s seasonally adjusted unemployment rate is based on the adjustment used by the Bureau of Labor Statistics in the same month of the previous year.
On an unadjusted basis, the March unemployment rate matches the previous low since Gallup began monitoring and reporting unemployment in January 2010. The unadjusted unemployment rate was last at 8.4% in October and November 2011. On a seasonally adjusted basis, March’s 8.1% reading is near the monthly low of 7.9% for Gallup’s U.S. unemployment rate, seen in January of this year. In both cases, Gallup trends show the U.S. unemployment rate declining dramatically over the past year.
This is some good news for the American economy. And, why President Obama has been rising in the polls, as of late.
Americans are feeling better about their jobs and their economic job prospects.
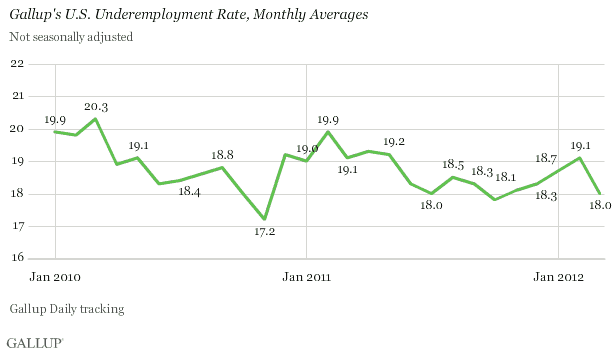
Underemployment has dramtically fallen.Gallup’s U.S. underemployment measure combines those unemployed with those working part time but looking for full-time work. As a result of sharp declines in both of these groups, the underemployment rate, on an unadjusted basis, fell to 18.0% in March from 19.1% in February 2012. The underemployment rate declined to as low as 18.0% last July before reversing course in August; it also increased from November through January.
Here is the chart:
Now, these numbers are from Gallup and not the government, Bureau of Labor Services. Here is the comparison chart:
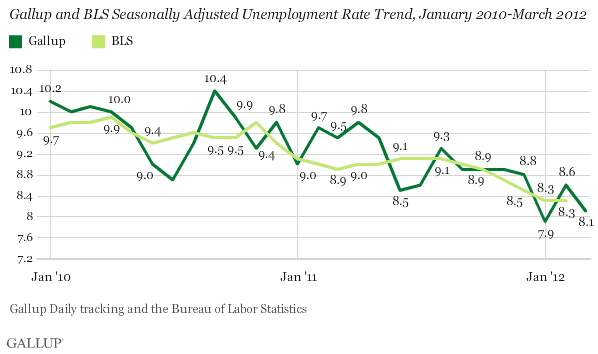
Whichever the numbers, there is a decided downward trend = good news for Americans.
So, what does this all mean?
Gallup’s seasonally adjusted unemployment rate decreased in March to 8.1%, slightly higher than January’s 7.9% reading but an improvement from 8.5% in Gallup’s preliminary mid-March estimate. The March and January rates are the two lowest since Gallup began monitoring and reporting unemployment in January 2010. They are also consistent with Gallup’s other behavioral economic data for March showing a new high in Gallup’s Economic Confidence Index and a post-recession high in its Job Creation Index as well as strong consumer spending.
While the sharp drop in the U.S. unemployment rate during recent months is clearly good news, it raises some significant economic questions. Traditional economic analysis raises the question of why the unemployment rate is falling much more rapidly than can be justified by the modest pace of current economic growth. Answering this question is essential to determining the sustainability of the declining trend in unemployment.
Federal Reserve Board Chairman Ben Bernanke made this issue the centerpiece of his recent speech to the National Association for Business Economics, noting, “the better jobs numbers seem somewhat out of sync with the overall pace of economic expansion.” He went on to explain his hypothesis that companies shed many more jobs than necessary during the recession and financial crisis of 2008-2009, and now they are correcting their workforces for this understaffing of the past. The chairman went on to suggest that achieving further declines in the unemployment rate is likely to require a more rapid pace of economic growth going forward.
f Bernanke is right, then the rapid decline in the unemployment rate might be approaching its end as individual businesses achieve a right-sizing of their workforces. Further, traditional economics also suggest that many people who have been sitting on the sidelines waiting for the economy to improve might decide that now is the time to seek a job, increasing the baseline figure used to calculate unemployment. In turn, this could keep the unemployment rate from decreasing or even send it higher, negatively affecting economic confidence and the overall economy — not good news for political incumbents, including the president.
On the other hand, the economy might continue to build on the momentum indicated by the current positive trend in Gallup’s behavioral economic data, or perhaps the economy is already growing faster than the current economic data suggest. Either way, if true, the unemployment rate could fall below 8.0% in the not-too-distant future — particularly if the workforce does not grow — meaning good things for the economy, incumbents, and the president’s re-election effort.
In other words, this decline in unemployment and underemployment may be an outlier from economic activity or a portent for increasing economic growth to come.
Again, stay tuned…
-
ObamaCare Poll Watch: Number of Uninsured Young Americans Has Reached a Plateau

According to the latest Gallup Poll.The percentage of 18- to 25-year-old Americans who do not have health insurance has leveled off at the 24% range, after declining from about 28% after the healthcare law provision allowing adults up to age 26 to stay on a parent’s plan took effect.
The uninsured rate for 18- to 25-year-olds first began to decline in the fourth quarter of 2010 after the provision went into effect in September, falling to 26.3% from 28.0% in the third quarter of that year. It then declined further to 24% in the first quarter of 2011 and has remained at about that level since, with the exception of a slight temporary increase the third quarter of 2011.
The uninsured rate for 26- to 64-year-olds has also leveled off. Although, in contrast to 18- to 25-year-olds, the current uninsured rate for 26- to 64-year-olds has plateaued at a higher rate than in January 2008, when Gallup and Healthways first started tracking Americans’ health insurance coverage. Roughly one in five Americans in this age group report not having health insurance for the past year.
One of the political arguments in support of the Affordable Care Act (ObamaCare) is that by either the Supreme court striking down the law or a legislative/executive repeal that the government would be taking health insurance away from younger people who can join their parent’s plan.
Looking at the graph above, it is a whopping 4 per cent at best.
Not much of an argument, is it?
But, in the meantime, look what has happened to private health insurance after ObamaCare passed.
 Surprise – employer-based private health insurance has declined and government paid health insurance (Medicare, Medicaid, or military/veterans’ benefits) has increased.
Overall, the percentage of all U.S. adults without health insurance was 17.3% in the first quarter of 2012, similar to its levels for the past year, although clearly lower than in 2008, 2009, and 2010. The increase in the percentage of all Americans who were uninsured in the second quarter of 2011 coincides with Gallup’s decision to include more cell phone-only respondents in the U.S. beginning April 1. Thus, some of the increase in the uninsured could reflect the greater representation of cell phone-only respondents — who tend to be younger — in Gallup samples.
Meanwhile, the percentage of all adults who get their health insurance through an employer has trended down — now at 44.5%. The percentage who have a government plan through Medicare, Medicaid, or military/veterans’ benefits has increased over time — now at 25.3%.
So, what does this all mean?
The U.S. Supreme Court last week heard arguments about the constitutionality of the 2010 healthcare law. During the hearings, the justices raised questions about how and if to save different parts of the health law should they decide against the individual mandate. While the final ruling is months away, if the court should decide to strike down the entire law — which includes the provision allowing those up to age 26 to stay on a parent’s health plans — many young adults who have recently gained coverage would likely lose it.
Still, even as the law remains intact for now, it appears that this part of the law that allows those up to age 26 to stay on a parent’s plan may have reached a saturation point. Although millions of people took advantage of this provision when it first went into effect, it does not seem at this point to be having any additional effect on the uninsured rate among young adults. This may be because all or most of those who qualify and have an interest in taking advantage of the provision have already done so. Or, it could be that only those who are most informed have taken part and many others are still unaware of this provision.
-
Poll Watch: 55 Per Cent of Americans Favor an Anti- Missile Defense System Vs. 16 Per Cent Opposed

The United States Missile Defense Agency
According to the latest Rasmussen Poll.President Obama drew fire from his political opponents last week after he was overheard confiding to Russian President Dmitry Medvedev that U.S.-Russian missile defense negotiations would have to wait until after November’s elections, a time when the president should have more “flexibility”. Most voters nationwide currently favor a U.S. anti-missile defense system, and a majority believes a missile attack on the U.S. is likely to occur in the near future.
The latest Rasmussen Reports national telephone survey of Likely U.S. Voters shows that 55% favor the creation of a U.S. anti-missile defense system, while just 16% are opposed. Another 29% are undecided.
Something the President should keep in mind, before he negotiates anything flexible with our enemies.
-
President 2012 Poll Watch: Obama 49% Vs. Romney 45%
 According to the latest Gallup Poll.
If asked to choose between them today, 49% of U.S. registered voters say they would vote for Barack Obama for president, while 45% would choose likely Republican opponent Mitt Romney. While Obama’s advantage is not statistically significant, it is the largest he has had over Romney in Gallup polling to date.
Obama has a larger, significant lead, 51% to 43%, over Rick Santorum, Romney’s chief rival for the Republican nomination, in the March 25-26 USA Today/Gallup poll. In mid-February, when Santorum led as national Republicans’ choice for the nomination, he and Obama were tied.
Obama leads both Romney and Santorum among independent voters, faring slightly better against Santorum than he does against Romney. Romney and Santorum currently fare about equally well among Republican voters.
National polls don’t mean much as I have said over and over because of big urban areas that are predominantly Democratic. Also, registered voters rather than likely voters will skew results as well.
Let’s look at Gallup’s key battleground states poll.

Obama has a 51% to 42% lead over Romney in USA Today/Gallup polling of registered voters in 12 key swing states, conducted March 20-26. This is the first time in five measurements that Obama has held an advantage over Romney in those states.
Obama also leads Santorum in the swing states, by 52% to 41%.
What does this all mean?
Momentum has shifted towards President Obama because Americans perceive the economy getting a bit better. Also, the contraception flap with Rush Limbaugh and Rick Santorum has sullied the GOP national brand and Romney is receiving the fall out with women voters and independents.
You see, most Americans are not that tuned into what the real issues are and when Jon Stewart and Jay Leno start the mocking, perceptions will shift – especially with this no win issue. But, will they shift in key battleground states?
The key battleground state poll, however, is not an accurate portrayal. There are at this point of the campaign really only six states in play: Virginia, Ohio, Florida, Nevada, New Hampshire and North Carolina.
Romney will need to run the table with these states in order to win the Presidency.
-
Poll Watch: Oklahoma City Leads America in Job Creation for Metropolitan Areas – Pittsburgh Second
 According to the latest Gallup Poll.
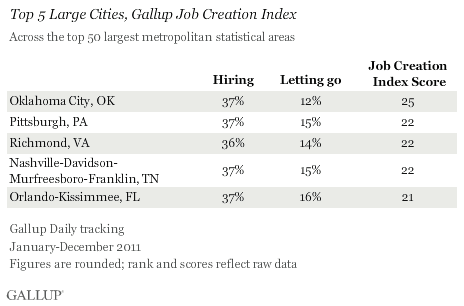
Oklahoma City, Okla., had the highest score on Gallup’s Job Creation Index among the 50 largest U.S. metro areas in 2011, followed by Pittsburgh, Pa., and several Southern metros. More than one in three workers in each of the top-performing metro areas said their employer was hiring or expanding the size of its workforce, but Oklahoma City led because of the relatively low percentage of workers (12%) who said their employer was letting workers go or decreasing the size of its workforce.
The metro areas surrounding Richmond, Va., Nashville, Tenn., and Orlando, Fla., complete the top five large metro areas with the highest Job Creation Index scores.
The results are based on Gallup Daily tracking interviews with U.S. workers conducted from January-December 2011. Gallup interviewed at least 698 respondents in each of the 50 largest metro areas in 2011, including 1,000 or more in 38 metro areas. Nationwide in 2011, an average of 31% of U.S. workers said their employer was hiring, while 18% said their employer was letting workers go, for a U.S. Job Creation Index score of +13.
The top-performing large metro areas have above-average hiring levels combined with below-average levels of letting go, resulting in high Job Creation Index scores. On the other side of the spectrum, some metro areas have relatively low hiring combined with high levels of letting go, resulting in low Job Creation Index scores.
Providence, R.I., Riverside, Calif., New York City, Sacramento, Calif., and Buffalo, N.Y., rank as the bottom five in net hiring among large U.S. metro areas.
Read the rest of the polling report.
Unfortunately, California and Nevada continue to struggle in the job hiring and letting go fronts.
What are the implications?
More employees will leave California for greener pastures in other less costly states, compounding on an already devastating California budget deficit.
And, in Nevada, voters may seek their revenge by voting out President Barack Obama in this Electoral College key battleground state.
-
President 2012 GOP Poll Watch: Romney Expands National Lead to 40% Vs. 26% for Santorum Vs. 14% for Gingrich

According to the latest Gallup Poll.Mitt Romney’s national support among Republican voters has surged in recent days, coincident with his decisive victory in the Illinois primary and a prominent endorsement from Jeb Bush. Romney’s support has increased to 40%, the first time a candidate has reached that level in this campaign, and his lead over Rick Santorum is back into double digits after narrowing to four percentage points on March 20.
The data are based on Gallup Daily tracking from March 18-22, an eventful time in the GOP campaign. On March 20, Romney won the Illinois primary, and he got Bush’s endorsement the next day. That same day, a Romney aide hinted the former Massachusetts governor would “reset” his positions for the general election campaign in the same manner a child would shake an “Etch-a-Sketch” toy to clear it, which again raised concerns about Romney’s issue consistency.
Romney’s current positioning could also be affected by the results of Saturday’s Louisiana primary, with polls showing Santorum leading there.
Maybe with gaffes from Romney and Santorum this week, Newt Gingrich can make another comeback?
But, it is becoming apparent that Mitt Romney will be the nominee, unless a contested or brokered convention becomes a reality.